SQL Data Exploration using COVID-19 Data
Some of the SQL techniques used:
UPDATE, NULLIF(), order by, MAX(), cast(), group by, table JOIN
Introduction
This project uses COVID-19 data from "Our World in Data" between 02-24-20 and 04-30-21. The data was explored to see if there were any notable patterns or relationship that could be seen by using various SQL tool and techniques.
The data was downloaded as excel files and converted to CSV files before being imported into a Microsoft SQL Server. The two databases are called dbo.CovidDeaths & dbo.CovidVaccinations
To view all of the code, please visit the GitHub Repository linked here: SQL Data Exploration GitHub Repository. I have highlighted a few parts of the project below.
Updating CovidDeaths table using NULLIF()
In order to avoid "divide by zero" errors in later calculations, any values of zero in the "total_cases" column are replaced with NULL. Also, any blank entrys for the column "continent" is replaced with a NULL value as well.

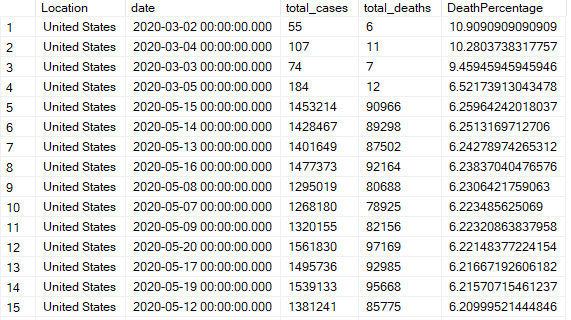
Comparing total deaths to total cases as a percentage in the US
Data from the "total_deaths" and "total_cases" columns were used to calculate the percent of total deaths vs total cases in the US and sorted from highest to lowest.

The results show the highest death percentages to be in March and May of 2020, which makes sense since it was early in the pandemic. But at the same time, the data in March is likely to be skewed due to very small number of cases and deaths. This could have been because early cases and deaths were not being reported and recorded as accurately at that time.
Countries with the highest percent of cases per capita
This query uses the max total number of cases of COVID-19 and divides it by the population. The results were sorted/grouped by country, which is in the "location" columnn when the "continent" column does NOT have a NULL value. When "continent" is NULL, the "location" column contains the continent name instead of country name.
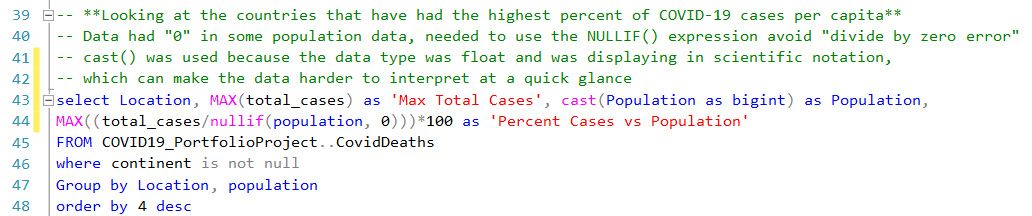
The results show that the highest number of cases per capita during the time frame of my dataset by country was as much as 17.13%. As with all the data in this dataset, it's possible that there are inaccuracies due to data reporting issues, where some countries may not be able to report their data as frequently, accurately, completely, etc.

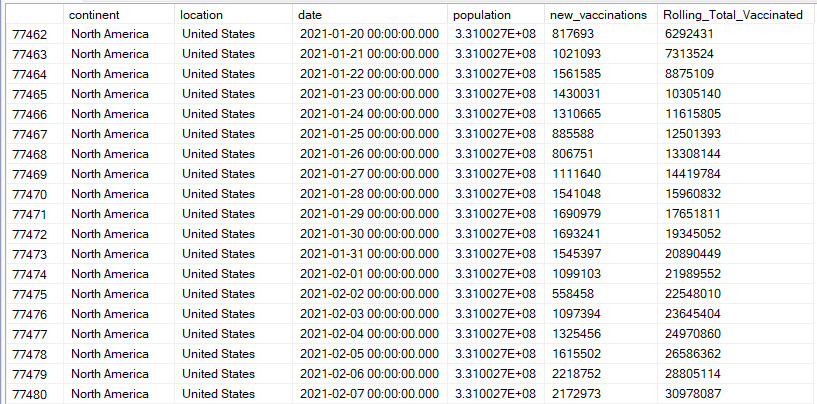
Joining the CovidDeaths & CovidVaccinations tables to compare data
By joining the two tables together, I'm able to compare the data column "new_vaccinations" with "population". In order to get an idea of total number of vaccinations over time I used the SUM() expression on "new_vaccinations" and partitioned the data by location.
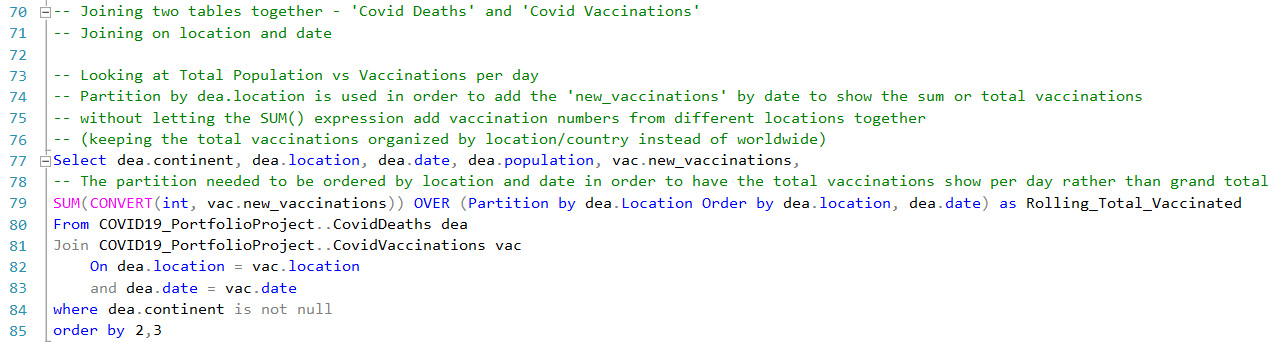
Looking at the last two columns, I can see that the query appears to be working correctly by adding the new vaccinations each day to a total or sum of all vaccinations given for a particular country.